The ability to collect, integrate, and meaningfully analyze huge volumes of disparate data – all within the acceptable elapsed time – is becoming a key competitive differentiator across all sectors. Big Data Analytics is helping companies gather superior and real-time market intelligence, reduce product development time, eliminate defects, attract more customers, enhance customer service etc., and do a lot more. But then, we are not talking of regular spreadsheets here…
What is Big Data?
Simply put – “Big Data” means too large and diverse data sets for traditional enterprise tools to process within tolerable elapsed time.
Data Explosion
From the dawn of civilization until 2003, humankind generated 5 exabytes of data. Now we produce 5 exabytes every two days. According to IDC (Digital Universe Study), the size of  data globally is expected to grow 44 times, i.e., from 0.8 zettabyte in 2009 to 35.2 zettabyte in 2020.
In the last couple of years, the world has witnessed an explosion in the volumes of data, while also creating almost 90% of the data that exists today. The social networks (250 million new photos on Facebook per day), video archives (48 hours of new videos on YouTube per minute), micro-blogging (200 million new posts on Twitter per day), genomics, sensors gathering climate information, video surveillance, call detail records, SMS, GPS, astronomy, large scale eCommerce, internet search records, credit card transactions, ATM records, etc. – all these are creating massive pools of data that are spread across the globe – in different formats, technology platforms, languages etc.
Big Data Characteristics
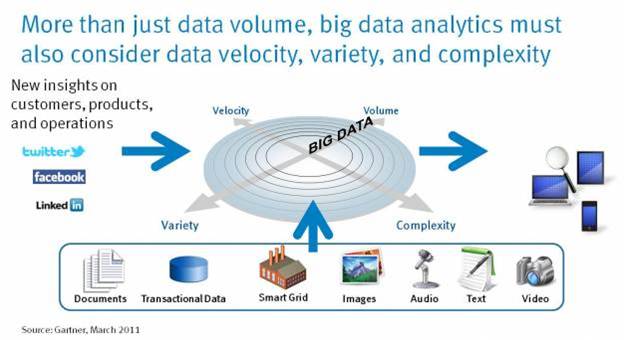
Just the sheer size of data (‘massive’) is not the issue facing organizations today. If it was so, then the challenge would have been confined to the power of PCs and spreadsheets. It is actually the unstructured (‘messy’) and distributed character of data that is beyond the reach of traditional enterprise tools. Big data demands a different approach to data warehousing and analytics. Of course, it demands high-end storage and computing power as well. In March 2011, Gartner, the leading industry analyst firm, classified the Big Data characteristics as Size, Velocity, Variety and Complexity, as portrayed in the image below.
Examples of Big Data
- Car Insurance Renewal (awesome demo by EMC at the Oracle World): Here an automobile insurance agent processes huge amount of disparate data on his laptop, such as customer’s profile, history, massive data from the telemetric device installed in the car, social media inputs, etc – all in real time, and then offers the best possible quote for insurance policy renewal. Simply amazing to see the power of Big Data!
- Pregnancy Prediction Model at Target: Most shoppers don’t buy everything they need at one store. Instead, they buy groceries at the grocery store, and toys at the toy store, and they visit Target only when they need certain items they associate with Target — cleaning supplies, say, or new socks or a six-month supply of toilet paper. But Target sells everything from milk to stuffed animals to lawn furniture to electronics. There are, however, some brief periods in a person’s life when old routines fall apart and buying habits are suddenly in flux. One of those moments — the moment, really — is right around the birth of a child, when parents are exhausted and overwhelmed and their shopping patterns and brand loyalties are up for grabs. So, the Target team crawled through their massive customers data, their buying history etc, and were able to identify about 25 products that, when analyzed together, allowed them to assign each shopper a “pregnancy prediction” score. More important, they could also estimate her due date to within a small window, so Target could send coupons timed to very specific stages of her pregnancy. The model clicked and as a result, their sales exploded. The funny part of the story however, is that once a man walked into a Target store and expressed anger on the coupons related to baby clothes, cribs etc that had been sent by Target to his daughter who was a high school student. A few days later, he apologized to the store manager after discovering that his daughter was actually pregnant. (read full story)
- Amazon.com: The world’s largest online retailer has over 1.5 billion items in its retail catalog, which gets more than 50 million updates a week. Plus, it has more than 200 fulfillment centers around the world. That’s a lot of objects in a lot of places to keep track of. At the Web 2.0 Summit in San Francisco last year, Alyssa Henry, VP – Amazon’s AWS Storage Services explained how her company is preventing theft of its most valuable as well as highly sought-after items. The company stores data on its S3 (Simple Storage Service), and uses Elastic Map Reduce (EMR), a new Hadoop framework that runs on its own Web Services (AWS) – to process this Big Data every 30 minutes, and feed it back to its warehouse and website. Just another example of how large companies are using Big Data analytics to stay agile in a fiercely competitive global marketplace.
- A couple of interesting examples are also provided under “Big Data Reporting” in this article.
The “Big” Opportunity
Information is more powerful than ever before as the early adopters of Big Data analytics are working hard to identify trends, correlate disparate sources of information while trying to make them easy to understand, and actionable. It is helping companies be smarter and more responsive to their customers as well as competitors.
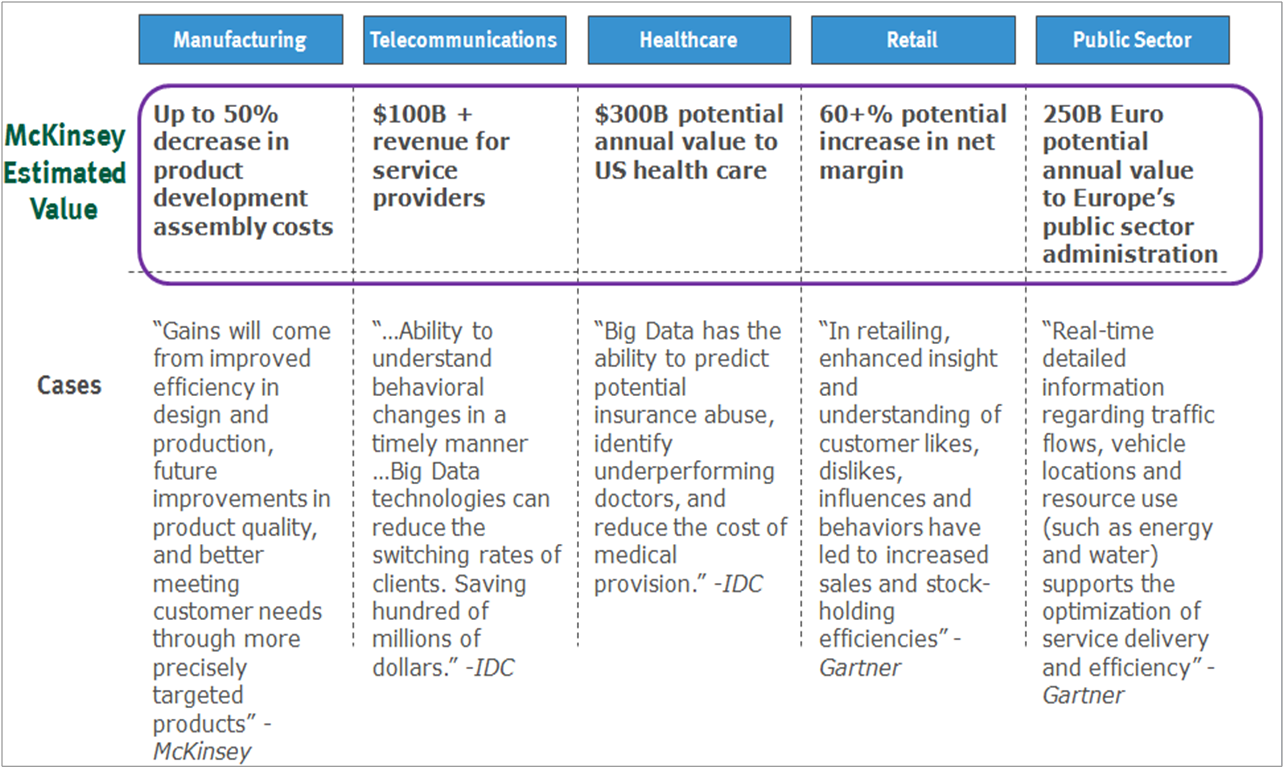
In other words, while this whole phenomenon of data explosion may look quite complex and overwhelming, it is actually setting new standards of intelligence and predictability for almost every sector, e.g., healthcare, manufacturing, telecom, retail, BFSI, law enforcement etc. Here is an example –
Snapshot of opportunities across verticals (dollar values estimated by McKinsey) –
Opportunity from Social Networks
One of the unique opportunity that social networking provides is to use all the data that is gathered, especially about potential customers, and then analyze it. Currently, companies such as Facebook, LinkedIn and Google know more about what people think of your company than you do. Having comprehensive data sets at our disposal is enabling more granular long-tail analysis, micro-segmentation, customer experience optimization, and digital marketing applications.
Companies – big and small – are looking at ways to harness the advantages of social networking technologies or products by adapting it within their organizations.
Components of Big Data
The Big Data stack includes six layers, as follows –
- Data,
- Integration (Data Management),
- Repository (Data Warehouse),
- Reporting,
- Analytics, and
- Applications
Almost all the big global IT companies, e.g., IBM, Google, Microsoft, EMC, Oracle, HP, TeraData etc are offering their products and services for one or more components of the Big Data stack. Not every IT company offers expertise across the entire Big Data stack. Several companies also offer cloud-based services, e.g., Amazon, 1010Data, Quantivo, Opera Solutions, HPCC Systems etc. Hence, it is important to properly understand the specific Big Data requirement in order to select the right technology vendor or partner.
“Big Data Reporting”: A New Paradigm of Management Reporting and Decision Support
As explained in the previous section, Big Data is not just about data mining or analytics. There are companies offering tools to handle “Big Data Reporting” that can help management take quick decisions.
Last year, Google launched Public Data Explorer, a tool that makes large datasets easy to visualize — and, for consumers, to play with. The Explorer has created interactive and dynamic data visualizations of information about traditionally hard-to-grasp concepts like unemployment figures, income statistics, world development indicators, and more.
Also, a must watch on YouTube is The Joy of Stats, an amazing 4-minute presentation by Hans Rosling about 200 years of history of 200 countries, where he has plotted 120,000 data points on a virtual screen. Besides the fancy technology used in the presentation, this video shows the potential of management reporting that could take ‘strategic planning and decision support’ to an altogether different level.
How Technology Solves Big Data
Here is a brief introduction to the most popular technology framework being used in the field of Big Data.
MapReduce: In 2004, Google introduced a software framework (Map & Reduce) to support distributed computing, on large data sets, on clusters of computers. In layman terms, ‘Map’ means the leader breaking down the problem into sub-problems and distributing them among the subordinates, who in turn can also repeat the same process. After problem solving, the answers are rolled up to the leader. ‘Reduce’ means leader combining the answers and creating the final output. In computing parlance, these jobs are performed by a cluster of computers.
Apache Hadoop: Inspired by Google’s MapReduce papers, this open-source software framework enables data-intensive distributed applications to work with thousands of nodes and petabytes of data. However, not all companies use Hadoop as part of their Big Data technology offering.
Challenges
As this new wave is evolving, the shortage of managerial talent to sense the big opportunity, as well as of the analytical talent to make use of Big Data is clearly emerging as the biggest challenge. Adding to the woes are tight IT budgets, dependency on third-party data, and also the lack of a cohesive regulatory framework for intellectual property, privacy and data security.
According to McKinsey, the United States alone could face a shortage of 140,000 to 190,000 people with deep analytical skills as well as 1.5 million managers and analysts with the know-how to use the analysis of Big Data to make effective decisions.
The Role of CFOs
Technology is taking center stage as companies scramble to optimize cost and attract more customers, while trying to make sense of the oceans of unstructured data. It’s time for the CFOs to look at the bigger picture and embrace this path-breaking transformation.
 “CFOs feel that there’s money out there in all that data,” says Forrester Research principal analyst Brian Hopkins. “The challenge is how to turn that data into new opportunities.” The good news, Hopkins says, is that new technologies are making it more economical to make sense of Big Data. The caveat is that these technologies will not provide opportunities; it is up to the people who make business decisions to gain insights to create and capture value.
In today’s rapidly changing world, the CFOs are playing a much bigger role as thought leaders and business partners. With the Big Data wave evolving, it is apparent that there is enormous business value in the ever-increasing digital information universe. It is imperative for the business to take a macro perspective of this data and make agile decisions, making apparent that the partnership between the CIO and the CFO will become more symbiotic in future.
It will also be critical for a CFO to tune in to the Big Data wave before a competitor does, and that means gaining an understanding of the technology frameworks churning the data sets, and knowing how to capture the transformational business value from the ‘massive and messy’ goldmine of Big Data.
Useful Links
- My article in “The Economic Times” (Mar 2012, all major city editions in India)
- Big Data – a fun explanation (video)
- Big data: The next frontier for innovation, competition, and productivity (McKinsey Global Institute)
- Wikipedia


I am intrigued to see the story about Pregnancy Prediction at Target. It is interesting but a little creepy. I am also surprised at how brains work.
Wow, wonderful blog! The full look of your site is excellent, as well as the content!